- Real-Time Monitoring:
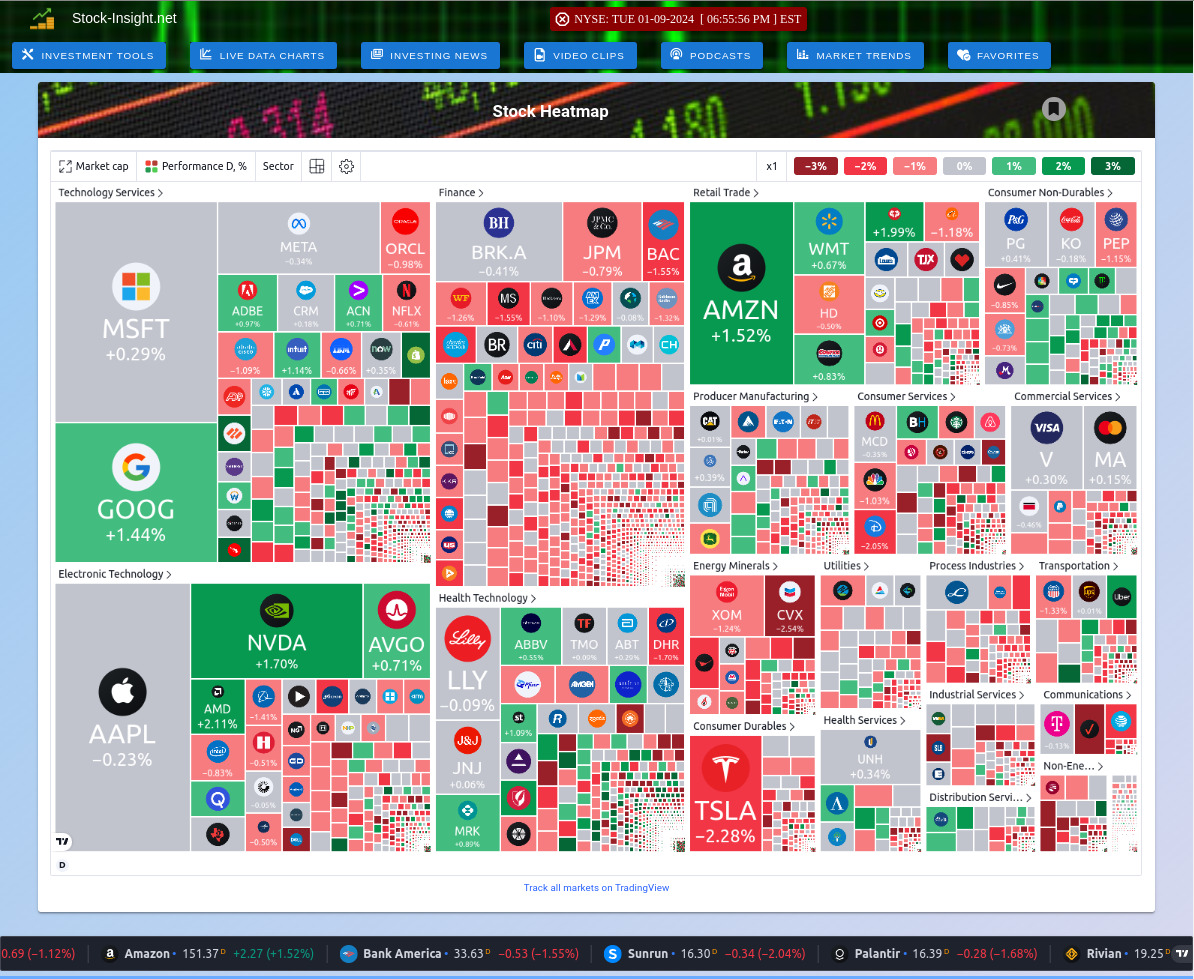
The heatmap updates in real-time, allowing users to see how stocks are performing throughout the trading day. This feature is crucial for identifying trends and making timely investment decisions.
- Visual Representation:
It employs a color-coded system to indicate changes in stock values. This makes it easy to spot trends, outliers, and overall market sentiment at a glance.
- Global Coverage:
Users can explore stocks from different countries and sectors, making it a versatile tool for global market analysis. This includes stocks from the US, Europe, and beyond.
- Sector and Country Grouping:
The heatmap allows users to group stocks by sector or country, facilitating comparative analysis. This feature helps investors focus on specific areas of interest or sectors that are performing well.
- Market Capitalization Comparison:
Users can compare stocks based on their market capitalization, which aids in assessing the relative size and impact of different companies within the market.
- Customization Options:
The heatmap can be customized to fit individual preferences, including display modes and color settings. This flexibility enhances user experience and allows for tailored analysis.
